Tell us about the job
Takes about a minute. No obligation.
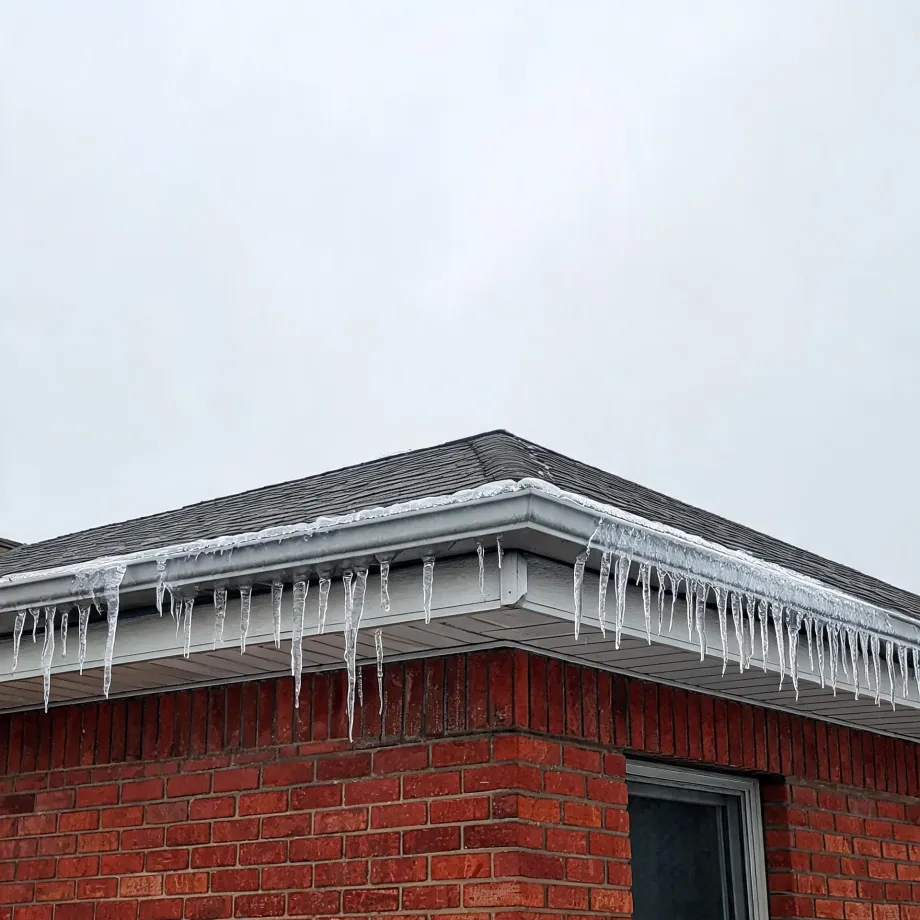
A heat pump here works against cold air for the bulk of its yearly runtime, which is when its capacity is already falling and its compressor is cycling harder to keep up. Homes in Carter County, MO run heat about seven months a year, from October through April. A contractor diagnosing a heat pump repair in this county looks at the compressor and the reversing valve first, because those are the components that absorbed the load during the coldest months, when the refrigerant circuit was under the most stress. Coil condition and refrigerant charge tell the story of how the system was holding up through that period.
Stock built to warm a house with one kind of system and later fitted for a heat pump carries that history inside the equipment. Refrigerant lines, contactors, and capacitors in houses like these have run through a long run of Missouri summers and winters, and what a contractor finds once the unit is open is not predictable from the curb. Half the homes in Carter County, Missouri were built in 1983 or earlier (2020-2024 ACS 5-year). That means the parts question is real: a contractor pulling covers on an aging heat pump here has to confirm what the system actually takes before pricing a repair, because some components in equipment of this vintage are no longer stocked at the distributor level.
The Parts of a Heat Pump a Contractor Checks During Repair
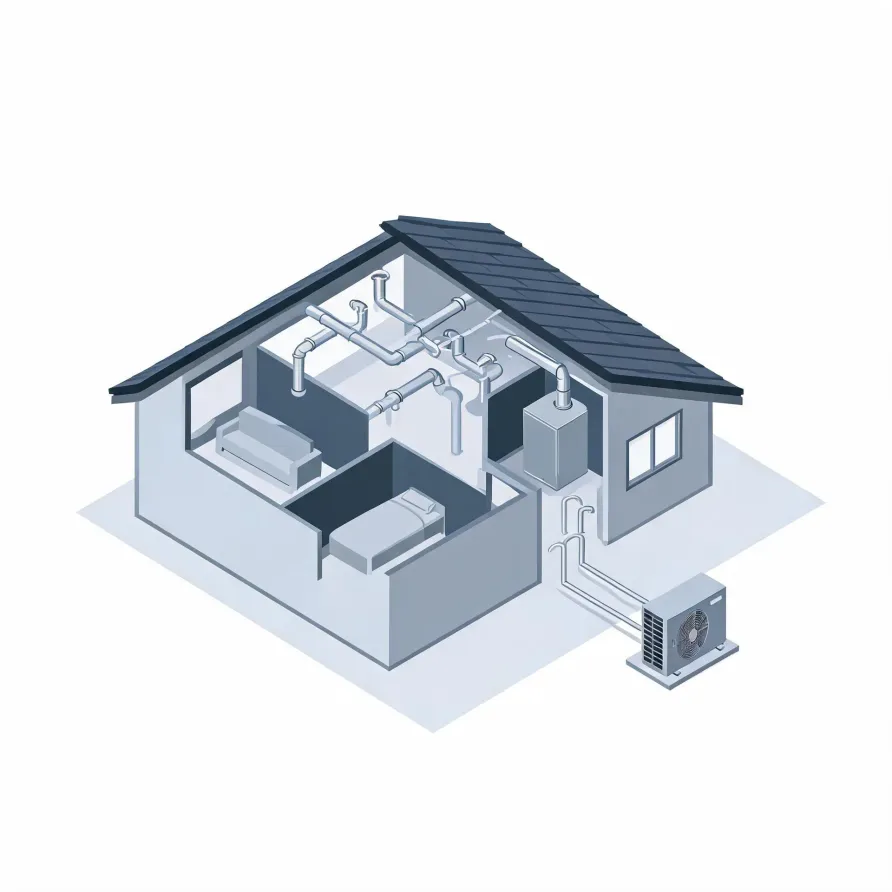
The outdoor unit is usually what draws attention first, sitting on a pad beside the house and holding the compressor and one set of coils. The compressor is the part contractors look at closely, since pressure and refrigerant problems show up there. The coils alongside it are another early stop, because damage or dirt there affects how the whole system behaves.
Inside the house, the air handler holds a second set of coils and the blower that moves conditioned air through the home. The reversing valve sits within the refrigerant loop and is what lets the system shift between heating and cooling. Refrigerant lines run between the two units, and the thermostat signals the whole system to start and stop.
The drawing shows a general layout of these components, and a licensed contractor will determine which parts apply to your specific setup.
Find a contractor in Carter CountyCarter County, by the numbers
115 severe weather events were recorded in Carter County, Missouri between 2015 and 2024.
NOAA National Centers for Environmental Information, Storm Events Database, bulk CSV export, events 2015-01-01 through 2024-12-31.Half the homes in Carter County, Missouri were built in 1983 or earlier (2020-2024 ACS 5-year).
U.S. Census Bureau, 2020-2024 American Community Survey 5-Year EstimatesCarter County, Missouri holds 2,676 housing units (2020-2024 ACS 5-year).
U.S. Census Bureau, 2020-2024 American Community Survey 5-Year EstimatesOwners occupy 60.7% of the occupied homes in Carter County, Missouri (2020-2024 ACS 5-year).
U.S. Census Bureau, 2020-2024 American Community Survey 5-Year EstimatesSevere Weather Events in Carter County
Heat pumps work hardest when the weather outside is most extreme, and that workload accumulates over years. How much stress the equipment in Carter County faces depends on what the local climate actually delivers, which is why the record below matters for repair decisions.
115 severe weather events, 2015–2024. Source: NOAA National Centers for Environmental Information, Storm Events Database.