Tell us about the job
Takes about a minute. No obligation.
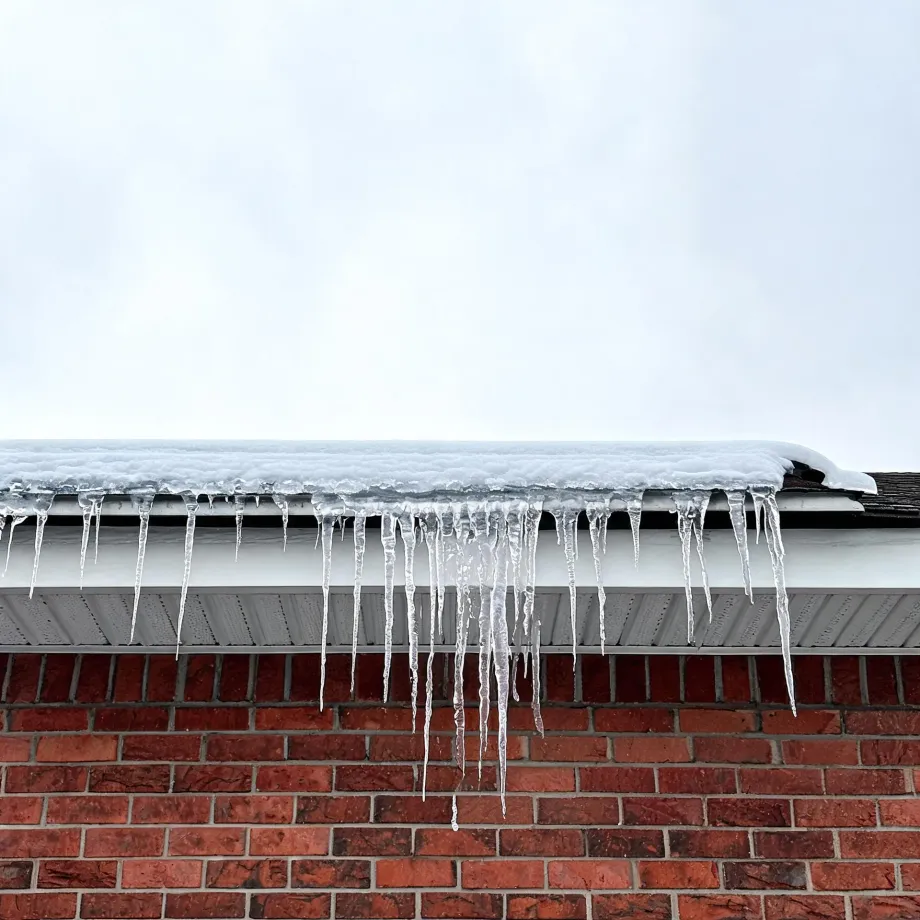
Sizing a heat pump for Carter County means accounting for what the heating season actually demands of the compressor and the refrigerant circuit, not just picking a unit by square footage. Homes in Carter County, MO run heat about seven months a year, from October through April. As outdoor temperatures drop through January and February, a heat pump loses capacity at the same time the house needs more of it. A contractor has to establish where that crossover point falls for this house before settling on equipment size and whether the backup heat strip is adequate. Get that wrong and the backup runs constantly through the cold months, driving up bills the homeowner will notice fast.
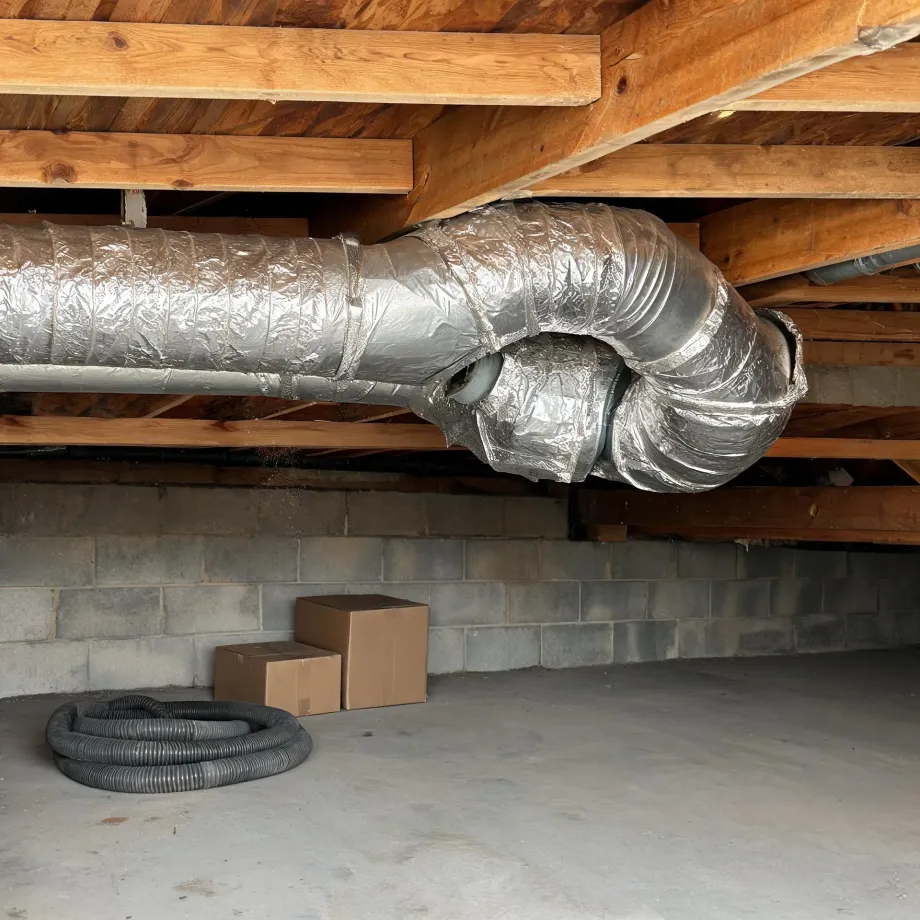
Ductwork in a house that was built around older heating equipment carries air on a schedule and at volumes that a heat pump's air handler does not share. Half the homes in Carter County, Missouri were built in 1983 or earlier (2020-2024 ACS 5-year). That spread through the housing stock means a contractor quoting a heat pump installation here spends real time on what is already in the walls and crawlspaces: whether the runs are sized for the airflow a heat pump needs, and whether the electrical service has the capacity the outdoor unit will draw. A system that works well starts with those answers.
What a Heat Pump Installation Covers
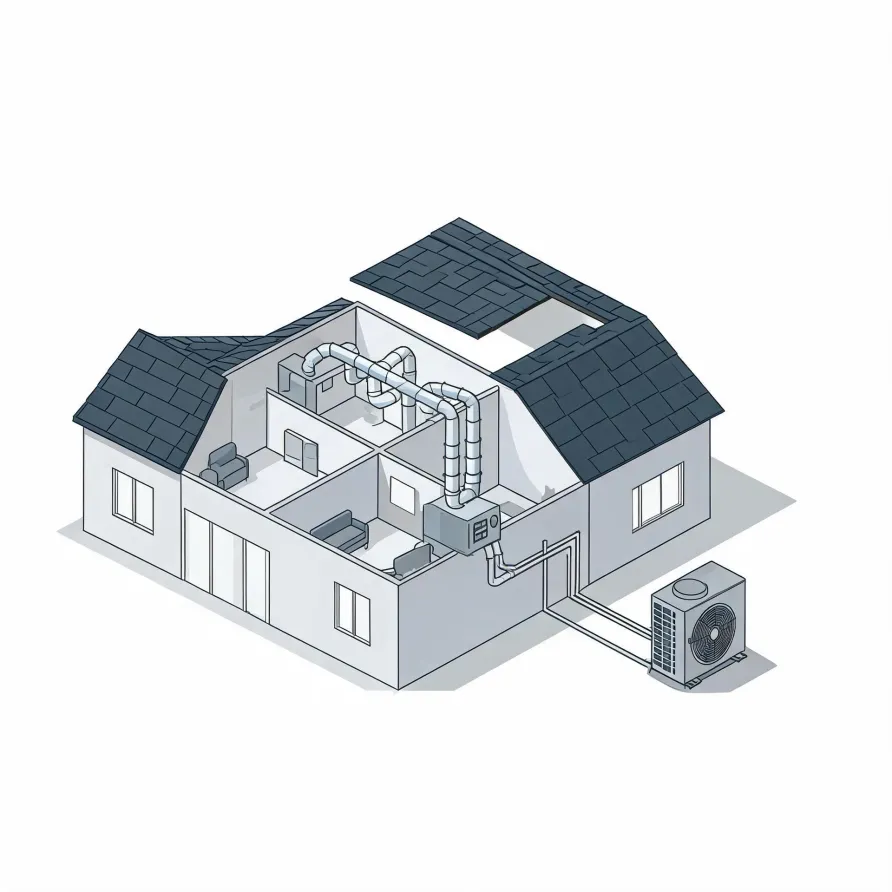
The outdoor unit sits on a pad beside the house and holds the compressor and the coil that exchanges heat with the outside air. Inside, the air handler mounts in a utility space, closet, or attic and moves conditioned air through the home. These two units are the core of what a contractor brings in and sets in place.
A refrigerant line set runs between the outdoor unit and the air handler, connecting the two and carrying the refrigerant that makes the system work as one. A thermostat goes on an interior wall where it reads the home's temperature and tells the system when to run.
The drawing shows a typical layout, and a licensed contractor determines exactly what applies to this house.
Find a contractor in Carter CountyCarter County, by the numbers
115 severe weather events were recorded in Carter County, Missouri between 2015 and 2024.
NOAA National Centers for Environmental Information, Storm Events Database, bulk CSV export, events 2015-01-01 through 2024-12-31.Half the homes in Carter County, Missouri were built in 1983 or earlier (2020-2024 ACS 5-year).
U.S. Census Bureau, 2020-2024 American Community Survey 5-Year EstimatesCarter County, Missouri holds 2,676 housing units (2020-2024 ACS 5-year).
U.S. Census Bureau, 2020-2024 American Community Survey 5-Year EstimatesOwners occupy 60.7% of the occupied homes in Carter County, Missouri (2020-2024 ACS 5-year).
U.S. Census Bureau, 2020-2024 American Community Survey 5-Year EstimatesSevere Weather Events in Carter County
Weather in Carter County puts real demands on heating and cooling equipment, and those demands shape what a well-matched heat pump needs to handle over its life. Sizing and installing to local conditions is not a general question here.
115 severe weather events, 2015–2024. Source: NOAA National Centers for Environmental Information, Storm Events Database.