Tell us about the job
Takes about a minute. No obligation.
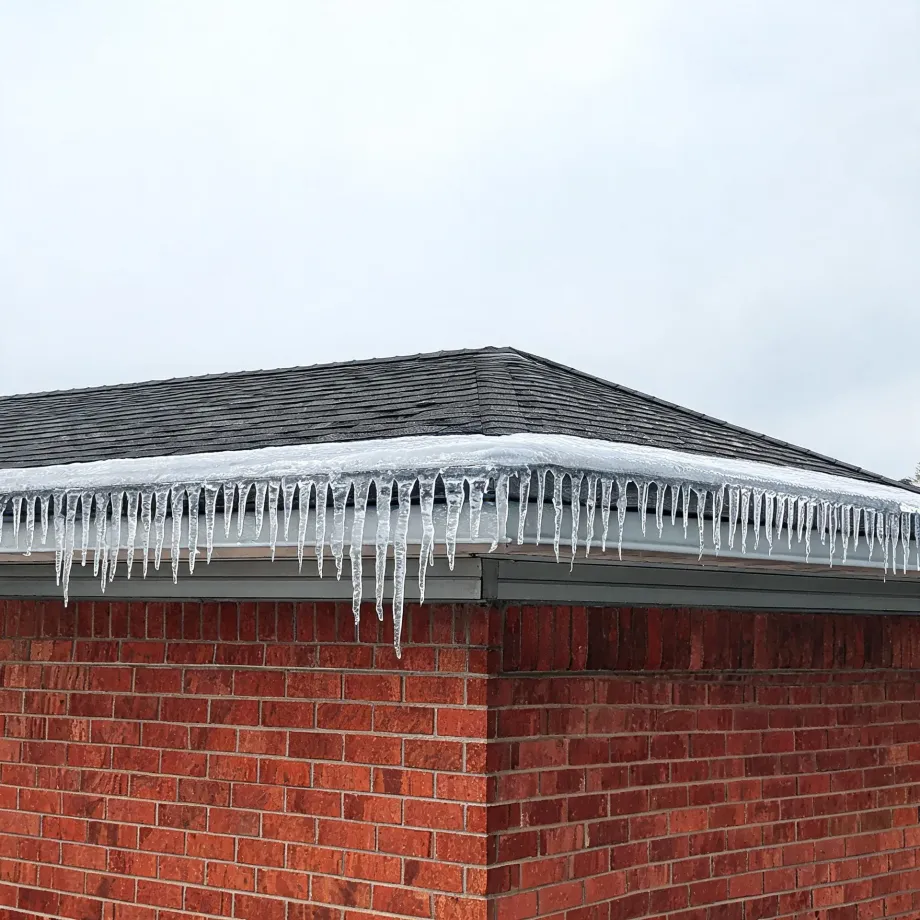
Sizing a heat pump for Barton County means accounting for what happens at the cold end of a long heating season, not just the mild shoulder months. Homes in Barton County, MO run heat about seven months a year, from October through April. A heat pump loses capacity as outdoor temperatures drop, so a unit sized loosely will lean on its backup resistance element through the stretches when the work is hardest. Contractors quote backup heat as a secondary system, but in a county with this kind of heating demand it is part of the primary sizing conversation.
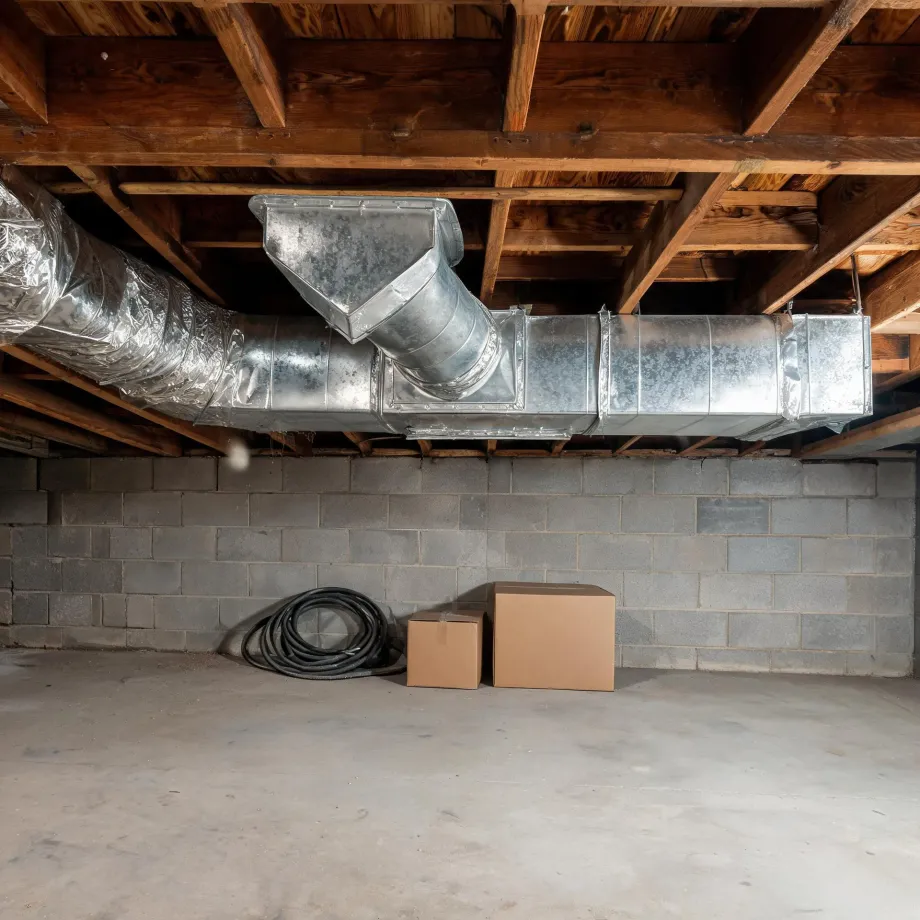
Ductwork laid out for a furnace moves air differently than a heat pump needs it to. Half the homes in Barton County, Missouri were built in 1974 or earlier (2020-2024 ACS 5-year). A heat pump runs longer, lower-temperature cycles, and ducts sized around a furnace's short, hot bursts can leave rooms under-supplied when the system switches over. A contractor quoting a heat pump here measures the existing runs, checks the returns, and prices the duct work before the equipment enters the conversation. The electrical service gets the same look, because the load a heat pump draws on startup has to match what the panel can carry.
What a Heat Pump Installation Puts in Your Home
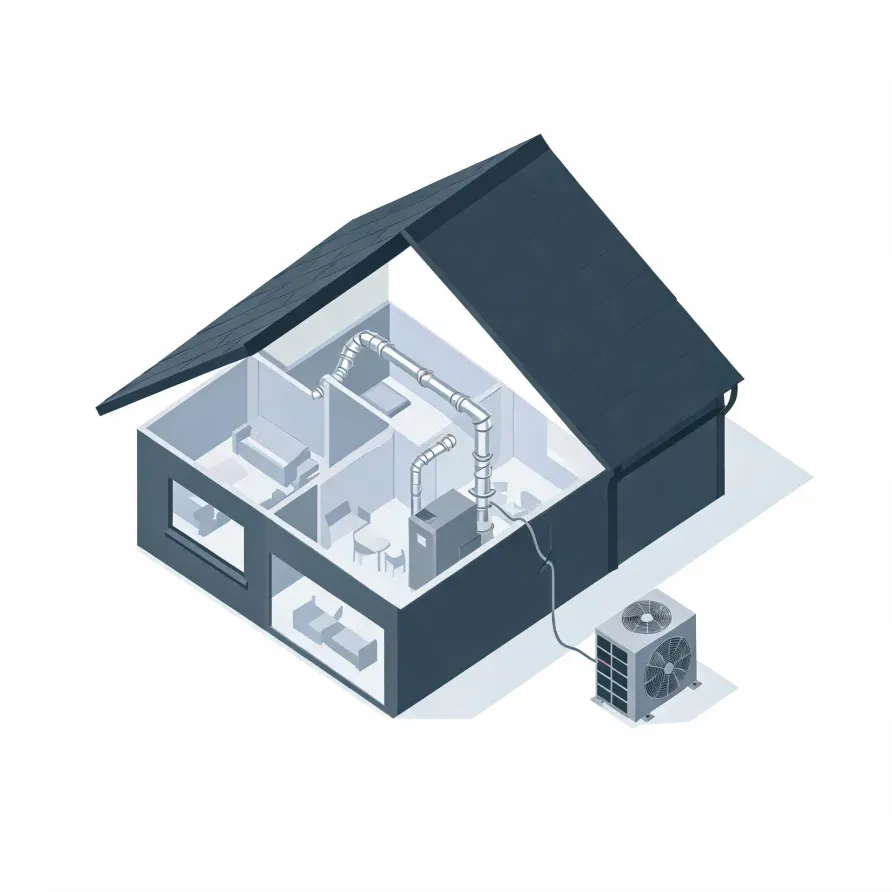
The outdoor unit is the piece a homeowner sees first, sitting on a pad beside the house, and it holds the compressor and the outdoor coil. Inside, the air handler mounts in a mechanical room, closet, or attic space and moves conditioned air through the home. These two units are the core of what a contractor installs.
A refrigerant line set runs between the outdoor unit and the air handler, carrying the working fluid that ties the two sides together. A thermostat goes on an interior wall and gives the homeowner control over the whole system. The disconnect box and any new wiring land near the outdoor unit to power it safely.
The drawing beside this text shows a typical layout, and a licensed contractor determines exactly how each piece fits the conditions in your house.
Find a contractor in Barton CountyBarton County, by the numbers
98 severe weather events were recorded in Barton County, Missouri between 2015 and 2024.
NOAA National Centers for Environmental Information, Storm Events Database, bulk CSV export, events 2015-01-01 through 2024-12-31.Half the homes in Barton County, Missouri were built in 1974 or earlier (2020-2024 ACS 5-year).
U.S. Census Bureau, 2020-2024 American Community Survey 5-Year EstimatesBarton County, Missouri holds 5,285 housing units (2020-2024 ACS 5-year).
U.S. Census Bureau, 2020-2024 American Community Survey 5-Year EstimatesOwners occupy 68.1% of the occupied homes in Barton County, Missouri (2020-2024 ACS 5-year).
U.S. Census Bureau, 2020-2024 American Community Survey 5-Year EstimatesSevere Weather Events in Barton County
The weather a county sees year after year sets the actual workload for any heating or cooling system installed there. A heat pump sized and specified for local conditions holds up where a generic install may not, which is why weather history is part of the picture for this service.
98 severe weather events, 2015–2024. Source: NOAA National Centers for Environmental Information, Storm Events Database.