Tell us about the job
Takes about a minute. No obligation.
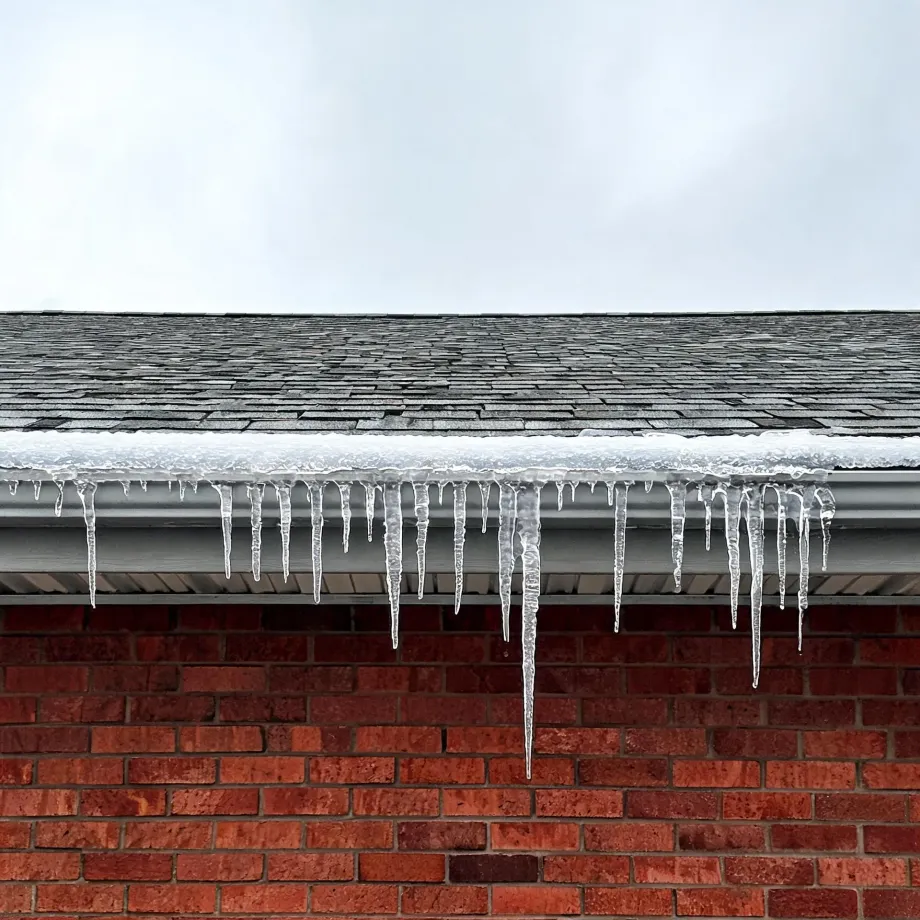
A contractor sizing a heat pump in Cedar County has to work out the back-up heat load before they can commit to a unit. Homes in Cedar County, MO run heat about seven months a year, from October through April. Through that stretch, outdoor temperatures regularly fall into the range where a heat pump's refrigerant cycle loses capacity, and the system leans on its auxiliary strips to keep the house warm. A unit sized without accounting for those conditions runs its back-up heat harder than it should, which shortens the life of the elements and drives up bills. The installer has to calculate both the heat pump's low-temperature output and the supplemental load before the equipment is ever ordered.
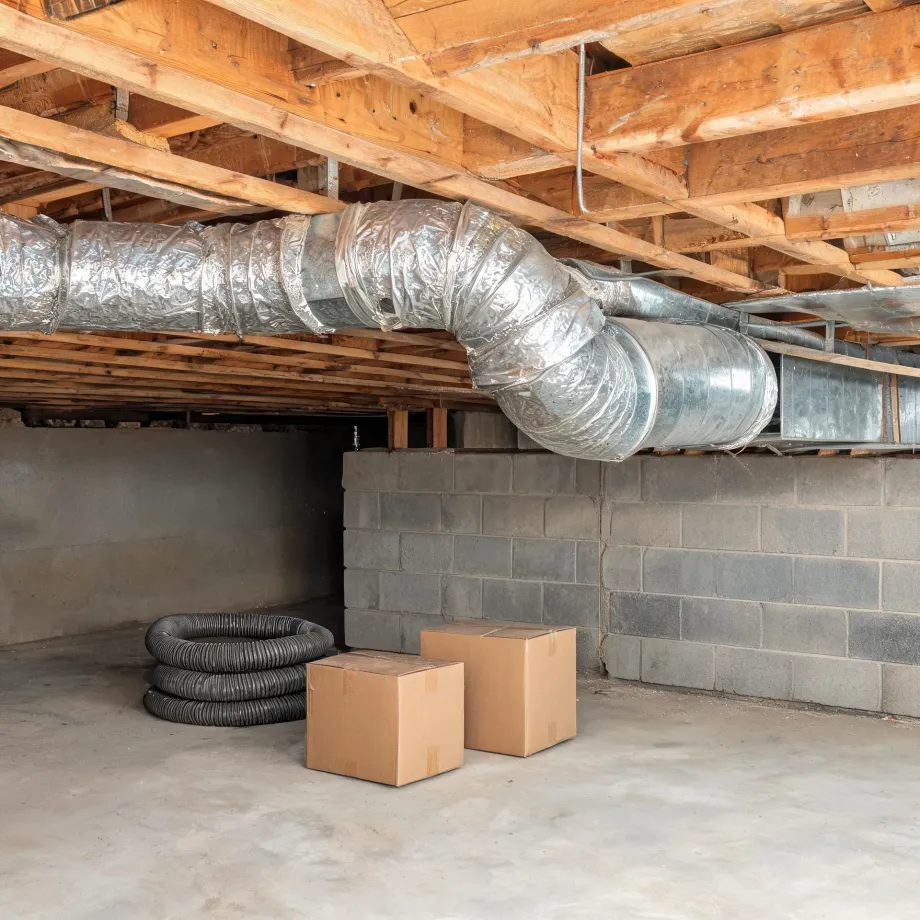
Ductwork put in to carry a different kind of system is what a heat pump contractor has to settle first in much of Cedar County. Half the homes in Cedar County, Missouri were built in 1980 or earlier (2020-2024 ACS 5-year). That generation of housing was typically built around furnaces and window units, so the trunk lines and branch runs were sized for airflow patterns a heat pump does not share. A contractor quoting an installation here prices the duct assessment before the equipment, because what the existing runs will and will not carry is what the job turns on.
What a Heat Pump Installation Covers
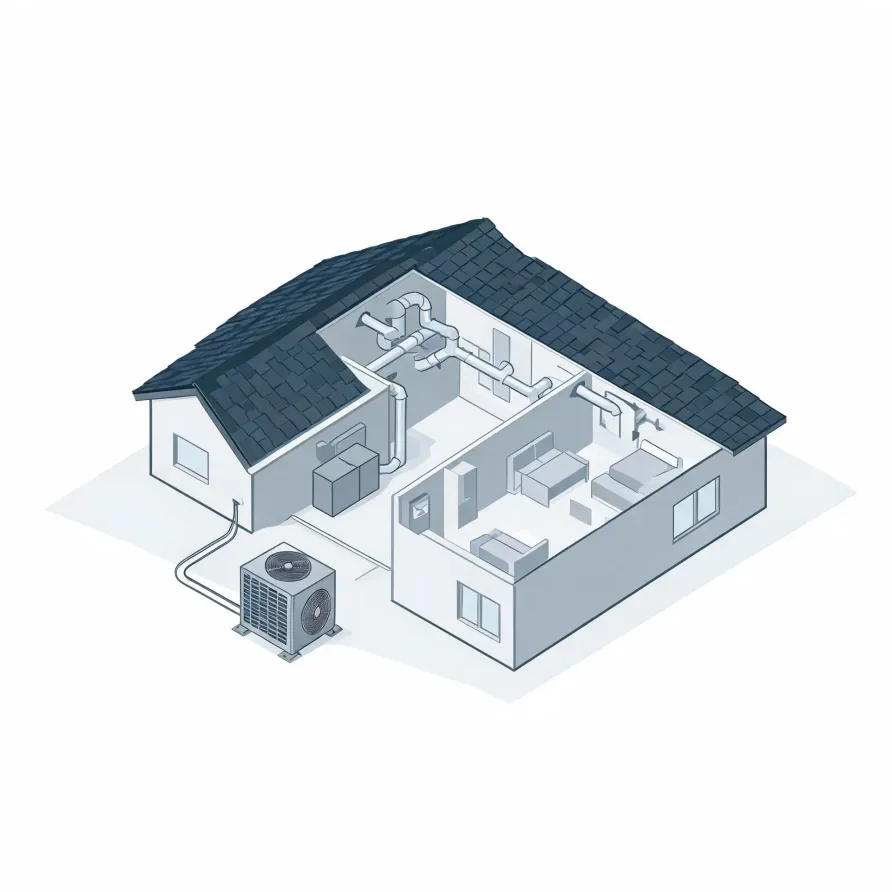
The outdoor unit sits on a pad beside the house and holds the compressor and the coil that exchange heat with the outside air. Inside, the air handler mounts in a utility space, closet, or attic and moves conditioned air through the home. These two units are the core of what a contractor puts in place.
A refrigerant line set runs between the outdoor unit and the air handler, and a condensate drain line carries moisture away from the indoor coil. A thermostat, mounted on an interior wall, is the control point the homeowner uses to set temperatures and switch between heating and cooling modes.
The drawing shows a typical layout, and a licensed contractor determines exactly how each piece fits the conditions of your house.
Find a contractor in Cedar CountyCedar County, Missouri, by the numbers
67 severe weather events were recorded in Cedar County, Missouri between 2015 and 2024.
NOAA National Centers for Environmental Information, Storm Events Database, bulk CSV export, events 2015-01-01 through 2024-12-31.Half the homes in Cedar County, Missouri were built in 1980 or earlier (2020-2024 ACS 5-year).
U.S. Census Bureau, 2020-2024 American Community Survey 5-Year EstimatesCedar County, Missouri holds 6,946 housing units (2020-2024 ACS 5-year).
U.S. Census Bureau, 2020-2024 American Community Survey 5-Year EstimatesOwners occupy 74.1% of the occupied homes in Cedar County, Missouri (2020-2024 ACS 5-year).
U.S. Census Bureau, 2020-2024 American Community Survey 5-Year EstimatesSevere Weather Events in Cedar County, Year by Year
The weather a region puts equipment through shapes what a heat pump has to do and how hard it has to work to do it. Sizing and installation decisions here are local decisions, and the pattern of weather events in Cedar County is part of what drives them.
67 severe weather events, 2015–2024. Source: NOAA National Centers for Environmental Information, Storm Events Database.