Tell us about the job
Takes about a minute. No obligation.
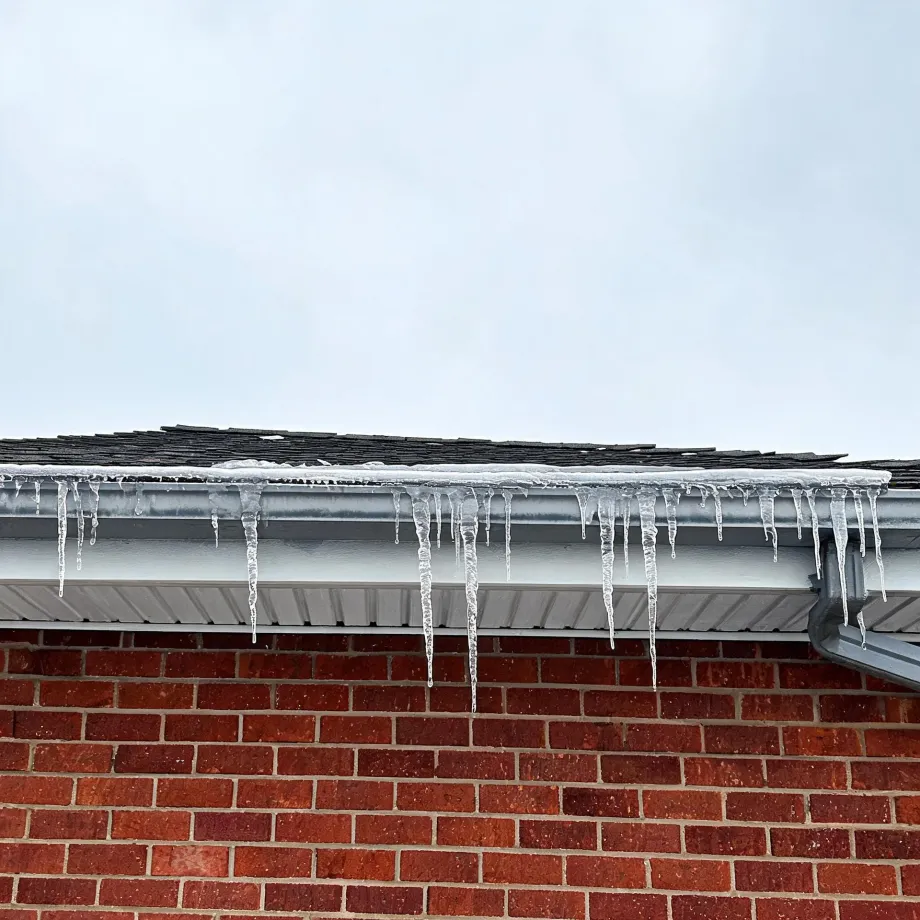
Sizing a heat pump for Nodaway County means committing to a number before a contractor can see how the equipment performs at the cold end of winter. Homes in Nodaway County, MO run heat about eight months a year, from October through May. As outdoor temperatures drop, a heat pump's capacity drops with them, and the backup heat strips have to pick up what the refrigerant cycle cannot deliver. A contractor who skips a proper load calculation leaves the homeowner with backup strips doing heavy seasonal work rather than emergency work, which is a different electrical load and a different operating cost than most homeowners expect going in.
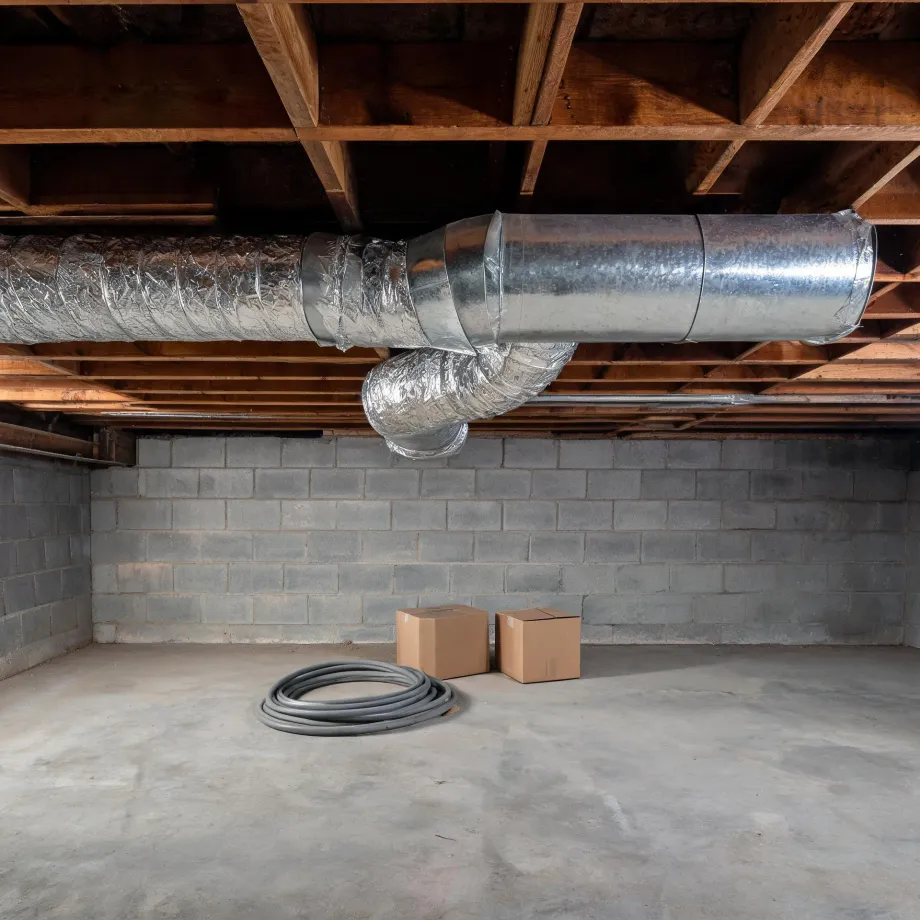
Existing ductwork is the variable that decides how a heat pump installation goes in Nodaway County. Half the homes in Nodaway County, Missouri were built in 1977 or earlier (2020-2024 ACS 5-year). Ducts laid out for a furnace carry air at different volumes and pressures than a heat pump wants, and a contractor has to assess whether what is already in the walls will work with the new equipment before sizing anything. If the runs are too restrictive, the system underperforms regardless of the unit selected. The electrical service gets the same look, since heat pump loads differ from what the original panel was designed to feed.
What a Heat Pump Installation Covers
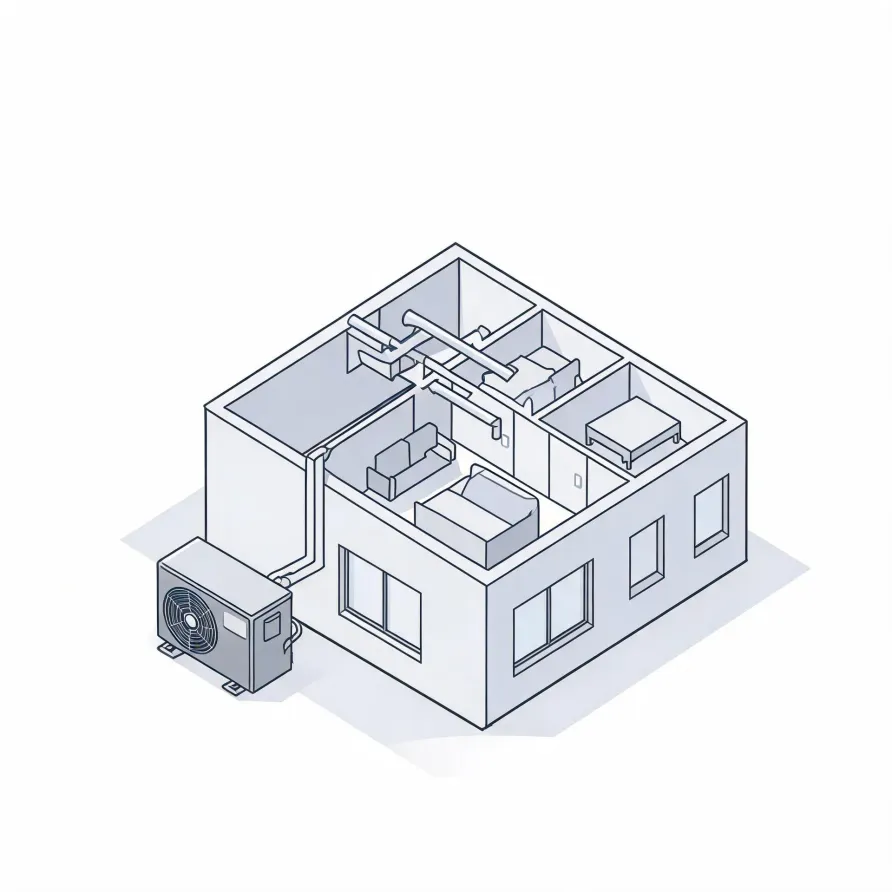
The outdoor unit sits on a pad beside the house and holds the compressor and the coil that exchange heat with outside air. Inside, an air handler mounts in a utility space, closet, or attic and moves conditioned air through the home. These two units are the core of what gets put in place.
A refrigerant line set runs between the outdoor unit and the air handler, carrying the refrigerant that links the two. A thermostat mounts on an interior wall and gives the homeowner control over the system. A condensate drain line runs from the air handler to a safe discharge point, clearing the moisture the system pulls from indoor air.
The drawing beside this text shows the general layout of a heat pump system, and a licensed contractor determines exactly how each piece fits the conditions of your specific house.
Find a contractor in Nodaway CountyNodaway County, by the numbers
128 severe weather events were recorded in Nodaway County, Missouri between 2015 and 2024.
NOAA National Centers for Environmental Information, Storm Events Database, bulk CSV export, events 2015-01-01 through 2024-12-31.Half the homes in Nodaway County, Missouri were built in 1977 or earlier (2020-2024 ACS 5-year).
U.S. Census Bureau, 2020-2024 American Community Survey 5-Year EstimatesNodaway County, Missouri holds 9,536 housing units (2020-2024 ACS 5-year).
U.S. Census Bureau, 2020-2024 American Community Survey 5-Year EstimatesOwners occupy 62.3% of the occupied homes in Nodaway County, Missouri (2020-2024 ACS 5-year).
U.S. Census Bureau, 2020-2024 American Community Survey 5-Year EstimatesSevere Weather Events in Nodaway County
Weather puts a measurable load on heating and cooling equipment, and that load varies by where you live. A heat pump sized and installed for Nodaway County's conditions works against what this county's weather actually delivers, not a national average.
128 severe weather events, 2015–2024. Source: NOAA National Centers for Environmental Information, Storm Events Database.